Note
Click here to download the full example code
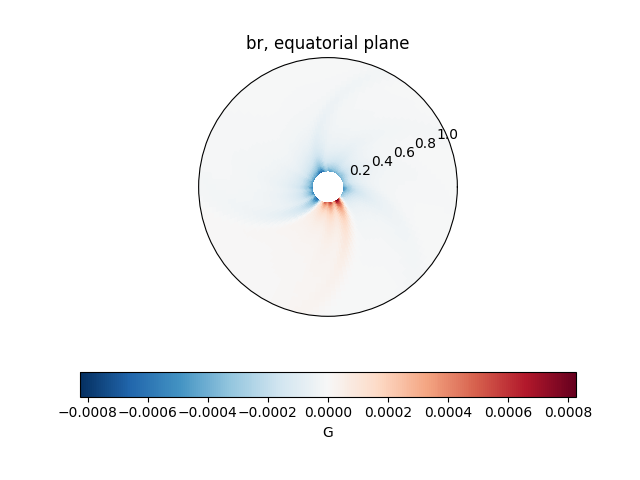
Changing the units of a plot
This example shows how to change the radial coordiantes. This is helpful if you want to change the radial coordinates e.g. from solar radii to AU.
First, load the required modules.
import astropy.units as u
import matplotlib.pyplot as plt

from psipy.data import sample_data
from psipy.model import MASOutput
Next, load a set of MAS output files. You will need to change this line to point to a folder with MAS files in them.
Convert from solar radii to AU
br = model["br"]
print(f"Old coords: {br.r_coords}")
br.r_coords = br.r_coords.to(u.AU)
print(f"New coords: {br.r_coords}")
Old coords: [ 29.25733757  30.74266243  32.22798538  33.71331024  35.19863129
  36.68395615  38.16928101  39.65460587  41.13992691  42.62525177
  44.11057663  45.59589767  47.08122253  48.56654739  50.05187225
  51.5371933   53.02251816  54.50784302  55.99316406  57.47848892
  58.96381378  60.44913483  61.93445969  63.41978455  64.90510559
  66.39043427  67.87575531  69.36107635  70.84640503  72.33172607
  73.81704712  75.30237579  76.78769684  78.27301788  79.75834656
  81.2436676   82.72899628  84.21431732  85.69963837  87.18496704
  88.67028809  90.15560913  91.64093781  93.12625885  94.6115799
  96.09690857  97.58222961  99.06755066 100.55287933 102.03820038
 103.52352142 105.0088501  106.49417114 107.97949982 109.46482086
 110.95014191 112.43547058 113.92079163 115.40611267 116.89144135
 118.37676239 119.86208344 121.34741211 122.83273315 124.3180542
 125.80338287 127.28870392 128.77403259 130.25935364 131.74467468
 133.22999573 134.71531677 136.20065308 137.68597412 139.17129517
 140.65661621 142.14193726 143.62727356 145.1125946  146.59791565
 148.08323669 149.56855774 151.05387878 152.53921509 154.02453613
 155.50985718 156.99517822 158.48049927 159.96582031 161.45115662
 162.93647766 164.42179871 165.90711975 167.3924408  168.8777771
 170.36309814 171.84841919 173.33374023 174.81906128 176.30438232
 177.78971863 179.27503967 180.76036072 182.24568176 183.73100281
 185.21632385 186.70166016 188.1869812  189.67230225 191.15762329
 192.64294434 194.12828064 195.61360168 197.09892273 198.58424377
 200.06956482 201.55488586 203.04022217 204.52554321 206.01086426
 207.4961853  208.98150635 210.46682739 211.9521637  213.43748474
 214.92280579 216.40812683 217.89344788 219.37878418 220.86410522
 222.34942627 223.83474731 225.32006836 226.8053894  228.29072571
 229.77604675 231.2613678  232.74668884 234.23200989 235.71733093
 237.20266724] solRad
New coords: [0.13606029 0.14296775 0.14987519 0.15678265 0.16369008 0.17059754
 0.17750499 0.18441245 0.19131988 0.19822734 0.20513479 0.21204223
 0.21894968 0.22585714 0.23276459 0.23967203 0.24657948 0.25348694
 0.26039438 0.26730183 0.27420929 0.28111672 0.28802418 0.29493163
 0.30183907 0.30874654 0.31565398 0.32256141 0.32946889 0.33637632
 0.34328376 0.35019123 0.35709867 0.36400611 0.37091358 0.37782102
 0.38472849 0.39163593 0.39854336 0.40545083 0.41235827 0.41926571
 0.42617318 0.43308062 0.43998805 0.44689553 0.45380296 0.4607104
 0.46761787 0.47452531 0.48143275 0.48834022 0.49524766 0.50215513
 0.50906257 0.51597    0.52287747 0.52978491 0.53669235 0.54359982
 0.55050726 0.55741469 0.56432217 0.5712296  0.57813704 0.58504451
 0.59195195 0.59885942 0.60576686 0.6126743  0.61958173 0.62648917
 0.63339668 0.64030411 0.64721155 0.65411899 0.66102643 0.66793393
 0.67484137 0.68174881 0.68865624 0.69556368 0.70247112 0.70937863
 0.71628606 0.7231935  0.73010094 0.73700837 0.74391581 0.75082332
 0.75773075 0.76463819 0.77154563 0.77845307 0.78536057 0.79226801
 0.79917545 0.80608288 0.81299032 0.81989776 0.82680527 0.8337127
 0.84062014 0.84752758 0.85443501 0.86134245 0.86824996 0.8751574
 0.88206483 0.88897227 0.89587971 0.90278721 0.90969465 0.91660209
 0.92350952 0.93041696 0.9373244  0.94423191 0.95113934 0.95804678
 0.96495422 0.97186165 0.97876909 0.9856766  0.99258404 0.99949147
 1.00639891 1.01330635 1.02021385 1.02712129 1.03402873 1.04093616
 1.0478436  1.05475104 1.06165855 1.06856598 1.07547342 1.08238086
 1.08928829 1.09619573 1.10310324] AU
Plot
cbar_kwargs = {"orientation": "horizontal"}
ax = plt.subplot(projection="polar")
br.plot_equatorial_cut(ax=ax, cbar_kwargs=cbar_kwargs)

plt.show()
Total running time of the script: ( 0 minutes 0.336 seconds)