Note
Click here to download the full example code
Plotting equatorial slices
This example shows how to plot slices in the equatorial plane from a MAS model output.
First, load the required modules.
from psipy.model import MASOutput
from psipy.data import sample_data

import matplotlib.pyplot as plt
Next, load a set of MAS output files. You will need to change this line to point to a folder with MAS files in them.
Each MAS model contains a number of variables. The variable names can be
accessed using the .variables attribute.
print(model.variables)
Out:
['br', 'rho', 'vr']
Set parameters for plotting. This line will give us a horizontal errorbar underneath the plots.
cbar_kwargs = {'orientation': 'horizontal'}
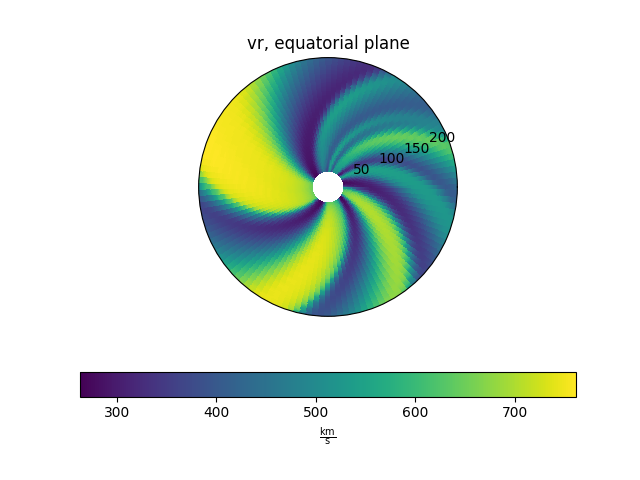
Plot the slices
ax = plt.subplot(projection='polar')
model['vr'].plot_equatorial_cut(ax=ax, cbar_kwargs=cbar_kwargs)

plt.show()
Total running time of the script: ( 0 minutes 0.216 seconds)