Note
Click here to download the full example code
Reading and visualising MAS runs
First, load the required modules.
from psipy.model import MASOutput
from psipy.data import sample_data

import matplotlib.pyplot as plt
Load a set of MAS output files.
Each MAS model contains a number of variables. The variable names can be
accessed using the .variables attribute.
print(model.variables)
Out:
['br', 'rho', 'vr']
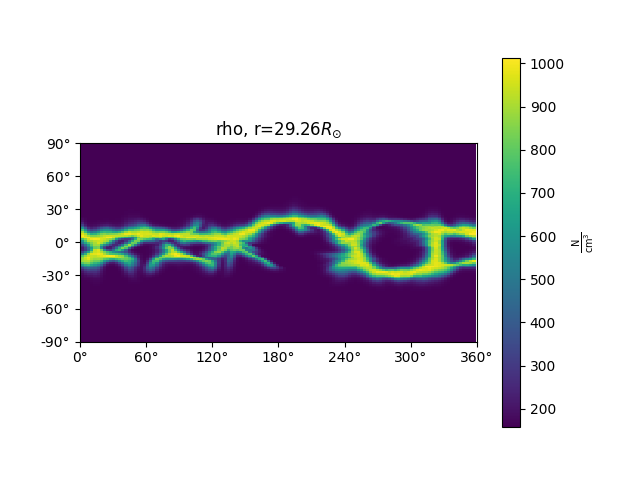
Plot a cut of the model at a constant radius
fig, ax = plt.subplots()
model['rho'].plot_radial_cut(0, ax=ax)
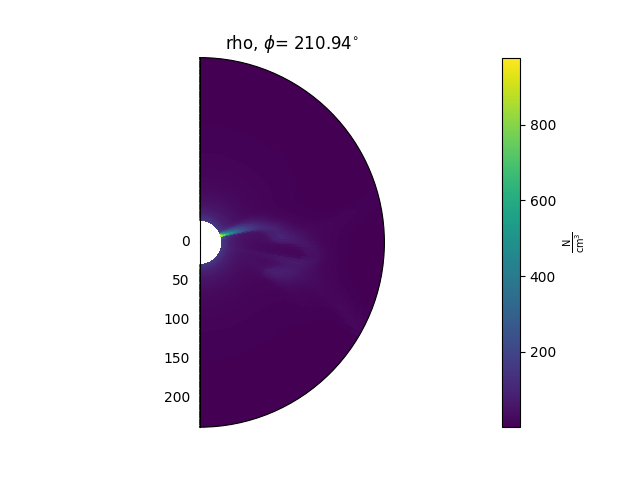
Plot a cut of the model at a constant longitude.
fig = plt.figure()
ax = plt.subplot(111, projection='polar')
model['rho'].plot_phi_cut(75, ax=ax)
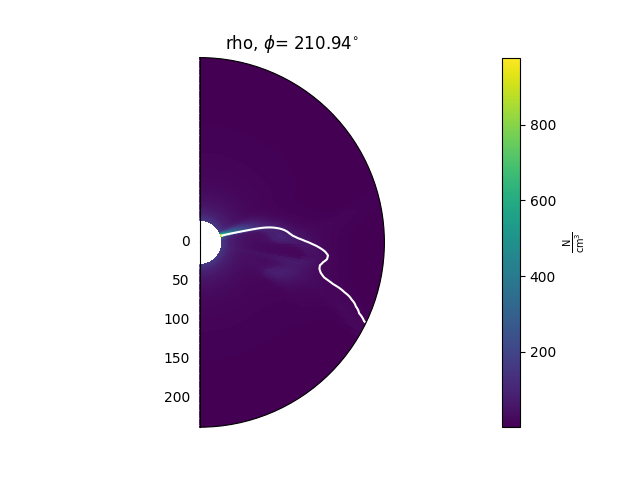
Add the current sheet
fig = plt.figure()
ax = plt.subplot(111, projection='polar')
model['rho'].plot_phi_cut(75, ax=ax)
model['br'].contour_phi_cut(75, levels=[0], ax=ax, colors='white')
plt.show()
Total running time of the script: ( 0 minutes 0.610 seconds)